Research Article - Neuropsychiatry (2017) Volume 7, Issue 5
Nonlinear Diagnoses on Autonomic Imbalance on a Single Night Before Treatment for Sleep Apnea: A Proposed Scheme Based Upon Heartbeat Indices
- Corresponding Author:
- Yuo-Hsien Shiau
Professor, Graduate Institute of Applied Physics
National Chengchi University, Taipei 11605, Taiwan, Republic of China
Tel: +886-2-29393091, ext. 62987
Fax: +886-2-29360360
Abstract
Objectives:
Recently, a unification of the diagnosis of sleep apnea (SA) and titration of continuous positive airway pressure therapy into a single night has potentially increased convenience of patients and economy of the sleep testing process. However, early diagnoses on the response of autonomic nervous system (ANS) would be fundamentally as well as clinically important. The goal of this study is to provide a diagnosing ANS scheme applied in a single-night process based upon heartbeat indices.
Methods:
Heartbeat indices R+ and R− were proposed for characterizing the activation degree of parasympathetic (R+) and sympathetic (R−) tone under different time windows (TWs), where the minimum and maximum TWs were 60 minutes and total time spent in overnight (ON) sleep, respectively. We also performed the correlation analyses on respiratory indices (AHI and DB) vs. heartbeat indices (R+ and R−). Analyzed subjects including SA patients as well as controls were obtained from Apnea-ECG Database, which has been publicly released in PhysioNet.
Results:
The correlation coefficients for R+(ON) vs. R+(60 min) and R−(ON) vs. R−(60 min) were, respectively, equal to 0.997 (P<0.001) and 0.998 (P<0.001). Heartbeat and respiratory indices exhibited significant relationships (P<0.01). The stable AUC profile along different TWs exhibited both high sensitivity and specificity for R+ and R− indices, where AUC (mean ± SD)=0.9342 ± 0.0027 for R+ and AUC (mean ± SD)=0.9007 ± 0.0155 for R−.
Conclusions:
We suggest that a unification of those cardiorespiratory indices (AHI, R+, and R−) would be clinically important for SA patients in a single-night polysomnography.
Keywords
Diagnosis, Sleep apnea, Heartbeat indices, Autonomic nervous system
Introduction
It is known that undiagnosed sleep disorders, particularly sleep apnea (SA), increase healthcare costs and are related with cardiovascular morbidity [1], psychiatric disorders [2], cognitive impairments [3], reduced work performance and occupational injuries [4]. Although the pathogenic effects are complex in SA, it is believed that autonomic imbalance should be involved [1]. Two-overnight polysomnography (PSG) for the diagnosis of SA and titration of continuous positive airway pressure (CPAP) therapy remains the gold standard practice in a sleep laboratory. Recently, a unification of the diagnosis (stage 1) and CPAP titration (stage 2) into a single night has potentially increased convenience of patients and economy of the sleep testing process. However, new diagnostic methods have been developed because of low accessibility and high cost of PSG, such as cyclic variation of heart rate (CVHR) [5,6].
Apnea/hypopnea index (AHI), the number of apnea and hypopnea episodes during 1 hour of overnight sleep, is a well-accepted measurement for diagnosing the severity of SA patients. Normal, mild, moderate, and severe stages are classified as AHI <5/hr, 5/hr to <15/hr, 15/hr to <30/hr, and ≥30/hr, respectively. A recent study suggested that AHI from the first 2 hours (2hr- AHI) and 3 hours (3hr-AHI) of sleep correlated strongly with the overnight- AHI (ON-AHI) [7]. These findings would be helpful for early diagnoses in stage 1.
CVHR is resulted from the cardiorespiratory interaction during episodes of SA, which consists of bradycardia during apnea followed by abrupt tachycardia on its cessation. Therefore, it would be expected that heartbeat indices could replace the target index AHI to be screening tools for the severity of SA. In addition, if these effective heartbeat indices can be obtained from the first time window (TW) of sleep, like the performance of AHI, it would be beneficial to significantly reduce cost of SA patients. Owing to that, the discovery of heartbeat indices to replace AHI has been an attractive/important topic for a long time [6]. Nevertheless, early diagnoses on autonomic nervous system (ANS) would be fundamentally as well as clinically important for SA patients in the sleep testing process. In this study, we will provide a diagnosing ANS scheme applied in a single night before treatment. Heartbeat indices R+ and R−, previously proposed for characterizing the activation degree of parasympathetic (R+) and sympathetic (R−) tone in time domain, would be potential tools for early diagnoses on autonomic imbalance in stage 1. In addition, the relationship between heartbeat indices and associated clinical variables will be discussed in details. The detailed calculations of R+ and R− indices can be found [8].
Methods
▪ Analyzed data
Three groups of subjects in stage 1 were considered in this study. Apnea (class A), mild-to-moderate apnea (class B), and control (normal, or class C) subjects were classified according to AHI. Our analyzed data including 40 recordings in class A, 10 recordings in class B, and 20 recordings in class C were obtained from Apnea-ECG Database, which has been publicly released in PhysioNet [9]. These subjects were 57 men and 13 women between 27 and 63 years of age. It should be noted that the Apnea-ECG Database also provided, in additional to AHI, the information of disordered breathing (DB) which counts the total time duration of apnea and hypopnea in the overnight sleep. Table 1 provided demographic characteristics of SA patients and controls.
| Characteristics | Class A (n=40) | Class B (n=10) | Class C (n=20) | P value |
|---|---|---|---|---|
| Age (mean ± SD; years) | 51 ± 8 | 47 ± 6 | 33 ± 5 | <0.001 |
| Height (mean ± SD; cm) | 176 ± 4 | 176 ± 4 | 175 ± _9 | 0.834 |
| Weight (mean ± SD; Kg) | 96 ± 14 | 94 ± 29 | 66 ± 9 | <0.001 |
| Length (mean ±SD; min.) | 507 ± 22 | 479 ± 38 | 468 ± 28 | <0.001 |
Table 1: Demographic characteristics of SA patients and controls.
▪ Statistical Analyses
The demographic data were compared between the three groups using one-way ANOVA. Significant differences were considered when p was less than 0.05. Concerning sensitivity and specificity analyses for apnea (Class A) and control (Class C) groups based upon results of heartbeat indices, areas under the receiver operating characteristic curves (i.e., AUC value) for different TWs were calculated. The correlation studies (r value) in between heartbeat indices (R+ and R−) and clinical variables (AHI and DB) for all analyzed subjects were performed, where the significant threshold was P<0.05.
▪ The calculation procedure
R+ and R− indices as a function of the first TW of sleep will be calculated. The minimum TW was 60 minutes in this study, then adding 20 minutes for the next calculation, and finally reaching to the total time spent in overnight (ON) sleep. If an index is independent of TW, it would be expected to potentially become a diagnostic tool. Therefore, the calculation procedure will ensure that whether R+ and/or R− are robust or not.
Results
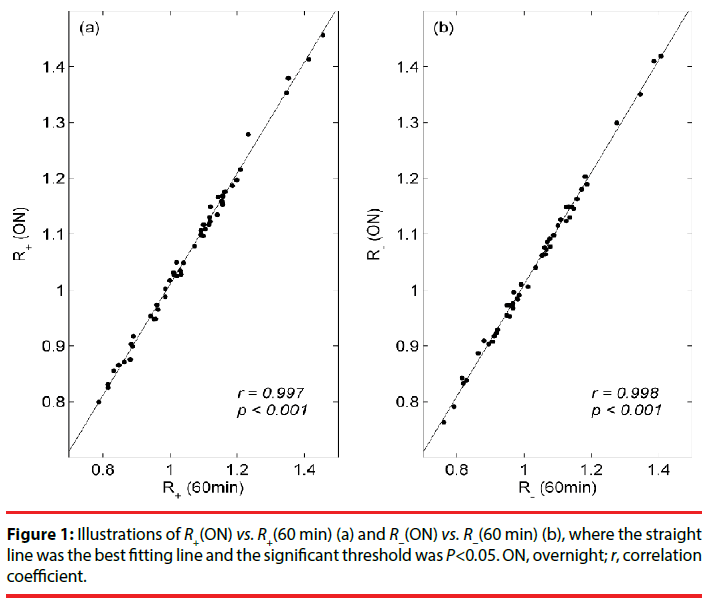
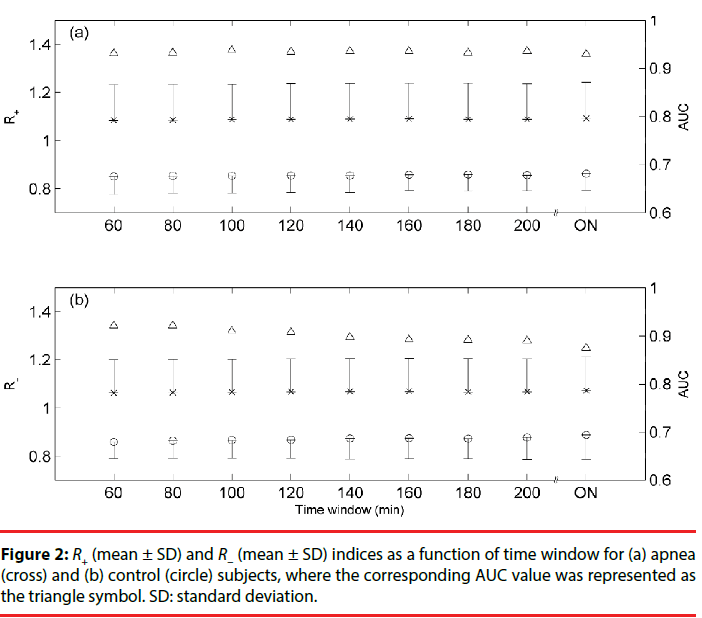
The scatter plots of Figure 1(a) and 1(b) illustrate, respectively, the relationships of R+(ON) vs. R+(60 min) and R−(ON) vs. R−(60 min) for all analyzed subjects, where the straight line was the best fitting line. The correlation coefficients (r) for R+(ON) vs. R+(60 min) and R−(ON) vs. R−(60 min) were, respectively, equal to 0.997 (P<0.001) and 0.998 (P<0.001). R+ (mean ± SD) and R−(mean ± SD) indices as a function of time window for apnea (class A, cross) and control (class C, circle) subjects were shown in Figures 2(a) and 2(b), respectively. In addition, the corresponding AUC value (triangle) for the differentiation of apnea and control subjects was depicted for each time window.
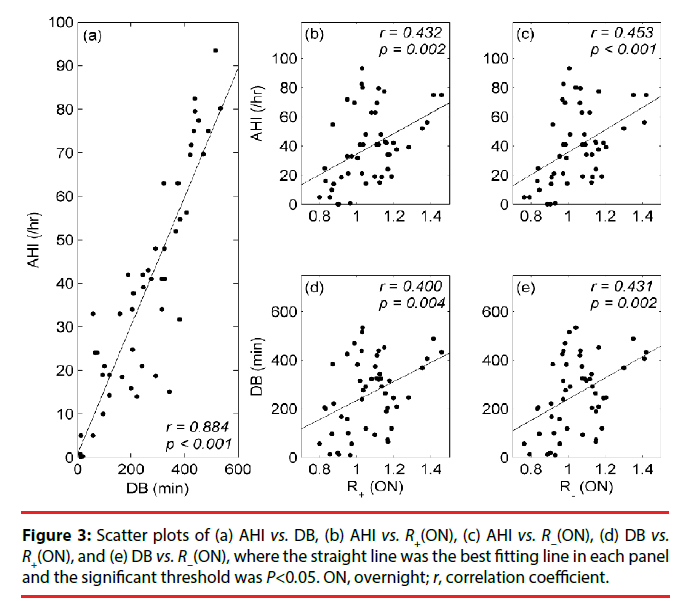
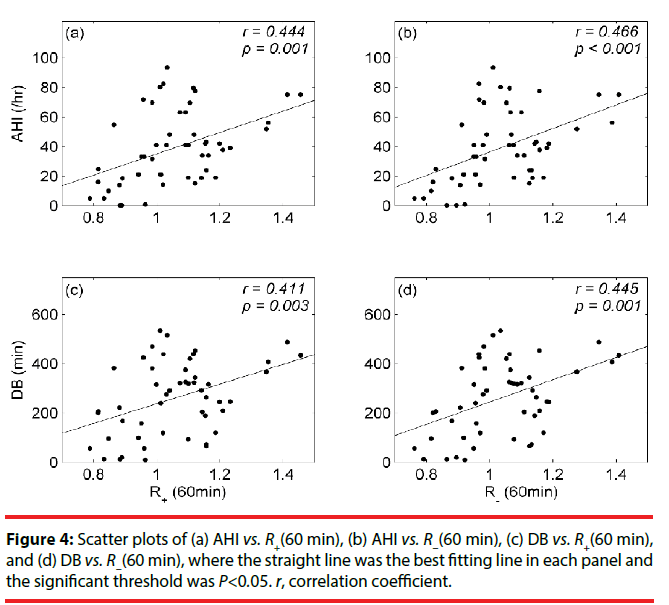
Figures 3 and 4 illustrate the relationships of our heartbeat indices (R+ and R−) and respiratory indices (AHI and DB) for all analyzed subjects. There were five scatter plots in Figure 3 including (a) AHI vs. DB (r=0.884, P<0.001), (b) AHI vs. R+(ON) (r=0.432, P=0.002), (c) AHI vs. R−(ON) (r=0.453, P<0.001), (d) DB vs. R+(ON) (r=0.400, P=0.004), and (e) DB vs. R−(ON) (r=0.431, P=0.002).
As for Figure 4, there were four scatter plots including (a) AHI vs. R+ (60 min) (r=0.444, P=0.001), (b) AHI vs. R−(60 min) (r=0.466, P<0.001), (c) DB vs. R+(60 min) (r=0.411, P=0.003), and (d) DB vs. R−(60 min) (r=0.445, P=0.001).
Discussions
Figures 1 and 2 demonstrate that both R+ and R− were robust for early diagnosing autonomic overactivity in SA patients during stage 1, where R+(60 min) and R−(60 min) were strongly correlated with R+(ON) and R−(ON), respectively. In particular, both R+ and R− were not sensitive to TW, thus our heartbeat indices displayed a nonlinear characteristic, rather than the traditional Fourier transform for exploring the interplay of parasympathetic and sympathetic tone. Besides, the stable AUC profile along different TWs exhibited both high sensitivity and specificity for R+ and R− indices, where AUC (mean ± SD)=0.9342 ± 0.0027 for R+ and AUC (mean ± SD)=0.9007 ± 0.0155 for R−.
The possible mechanisms to impact on the activation of ANS would be complicated in sleep. For example, quiet sleep can be characterized by concurrent vagal activation and sympathetic withdrawal. This kind of autonomic alternations is totally different in the rapid eye movement stage [10,11]. Periodic leg movements (PLMs) can make the similar arrhythmias pattern as that of SA. In well-controlled clinical settings people found that the efficiency of automated SA detection by heartbeat will be strongly reduced for subjects with a higher PLM index [6]. Owing to those possible factors related with the response of ANS, heartbeat and respiratory indices in Figures 3 and 4 exhibited lower correlation coefficients, however, significant relationships were still observed.
Based upon [7] and our present findings, the minimum time spent for diagnosing the severity as well as autonomic imbalance of SA patients in stage 1 should be chosen as 2 hours, where cardiorespiratory indices including 2 hr-AHI, R+(120 min), and R−(120 min) would be considered. Because the total sleep time is roughly equal to 8 hours, thus CPAP therapy can be performed for the next 6 hours. Therefore, reduction of evaluation time on important cardiorespiratory indices would be definitely helpful for the next treatment of SA patients in a single-night process.
Conclusions
To conclude, in this study an overall estimation on ANS by our proposed heartbeat indices R+ and R− would be potentially applied to SA through early diagnoses on autonomic imbalance in the sleep testing process. Although both heartbeat indices cannot replace AHI to become diagnostic methods for the severity of SA, however, a unification of these cardiorespiratory indices would be clinically important in a single-night PSG practice. Moreover, both sympathetic (R−) and parasympathetic (R+) excesses were characterized in SA patients; therefore, SA patients with cardiovascular morbidity would be expected.
Acknowledgement
This work was partially supported by Ministry of Science and Technology of the Republic of China (Taiwan) under Contract Nos. MOST104- 2112-M-004-001 and MOST104-2420-H-004- 005-MY3.
The authors declared no potential conflicts of interest in this study.
References
- Parish JM, Somers VK. Obstructive sleep apnea and cardiovascular disease. Mayo. Clin. Proc 79(8), 1036-1046 (2004).
- Gupta MA, Simpson FC. Obstructive sleep apnea and psychiatric disorders: A systematic review. J. Clin. Sleep. Med 11(2), 165-175 (2015).
- Davies CR, Harrington JJ. Impact of obstructive sleep apnea on neurocognitive function and impact of continuous positive air pressure. Sleep. Med. Clin 11(3), 287-298 (2016).
- Garbarino S, Guqlielmi O, Sanna A, et al. Risk of occupational accidents in workers with obstructive sleep apnea: Systematic review and meta-analysis. Sleep 39(6), 1211-1218 (2016).
- Guilleminault C, Connolly S, Winkle R, et al. Cyclical variation of the heart rate in sleep apnoea syndrome: mechanisms, and usefulness of 24 h electrocardiography as a screening technique. Lancet 1(8369), 126-131 (1984).
- Hayano J, Watanabe E, Saito Y, et al. Screening for obstructive sleep apnea by cyclic variation of heart rate. Circ. Arrhythm. Electrophysiol 4(1), 64-72 (2011).
- Khawaja IS, Olson EJ, van der Walt C, et al. Diagnostic accuracy of split-night polysomnograms. J. Clin. Sleep. Med 6(4), 357-362 (2010).
- Shiau YH, Sie JH. Dynamic assessment and overnight evaluation on autonomic imbalance in patients with sleep apnea via volatility clustering of descending (or ascending) heartbeat intervals. Int. J. Cardiol 168(4), 4506-4510 (2013).
- Goldberger AL, Amaral LAN, Glass L, et al. PhysioBank, PhysioToolkit, and PhysioNet: Components of a New Research Resource for Complex Physiologic Signals. Circulation 101(23), E215-E220 (2000).
- Baharav A, Kotagal S, Gibbons V, et al. Fluctuations in autonomic nervous activity during sleep displayed by power spectrum analysis of heart rate variability. Neurology 45(6), 1183-1187 (1995).
- Zemaityte D, Varoneckas G, Sokolov E. Heart rhythm control during sleep. Psychophysiology 21(3), 279-289 (1984).


